Nosokinetics
Surgical Waiting Lists in Australia
(c) Mark Mackay
(comments to rjtechne@iol.ie)A key story in The Australian (21 March 2005 page 1) reported trends in waiting times for surgery. Data came from the Australian Institute of Health
http://www.aihw.gov.au/hospitals/waitingtime_data.cfm
and from contact with individual governments. Four states provided comparative data. The histograms show how the average waiting time for the first 50% and the last 10% of operations shifted in four states between 2002-03 & 2003-04.
Only New South Wales decreased 50% waiting time for all operations. Waiting time increased for hips in two states, cataracts in three and knees in four.
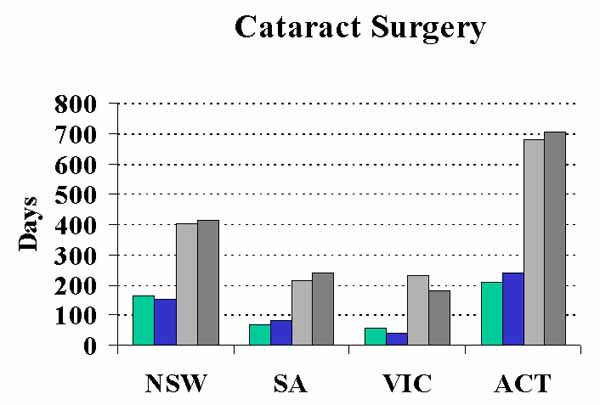
Figure 1 Change in the average number of days waiting for cataract surgery in four Australian States during financial years April to March 2002 ñ03 and 2003-04.
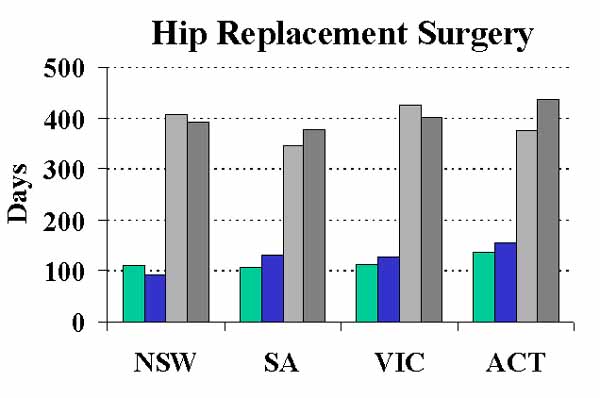
Figure 2. Change in the average number of days waiting for hip replacement surgery in four Australian States during financial years April to March 2002 ñ03 and 2003-04
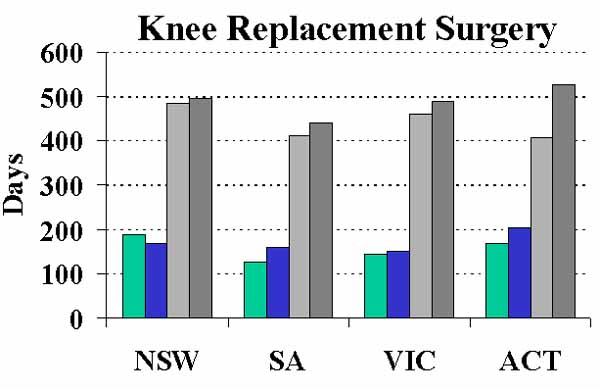
Figure 3. Average number of days waiting for knee replacement surgery in four Australian States financial years April to March 2002 ñ03 and 2003-04
The table shows, no state decreased waiting time for both groups and one state, South Australia, increased waiting times for the three surgical procedures.
Percentage surgical waiting time improvement / decline: 2002-03 to 2003-04
Fifty percent waiting time (median):Decrease: - 11% New South Wales
Increase: + 2% Victoria, + 16% Australian Capital Territories, + 25%South Australia
Upper 10% waiting time (90th percentile):
Decrease: - 20% Australian Capital territories, - 8% Victoria
Increase: + 1% New South Wales, + 9% South Australia
Australian federal and state governments are both responsible for public health. Throwing money at the existing system is not considered to be the answer. Seemingly there are enough surgeons and spare capacity in theatres to meet demand, but insufficient beds. It is suggested that a single level of government would encourage new means of tackling the problem and remove the exchange of blame between the different levels of government.
Analysing waiting lists is just another part of the issue of modelling patient flow. Rather than rhetoric and blame, surely, health care modellers should be providing evidence to help solutions to be found.
References:
C Pirani, Hospital waiting lists worsen, The Australian, 21 March 2005, p 1-2.;C Pirani, Money no cure for health system, ibid 21 March 2005, p 2.
Some navigational notes:
A highlighted number may bring up a footnote or a reference. A highlighted word hotlinks to another document (chapter, appendix, table of contents, whatever). In general, if you click on the 'Back' button it will bring to to the point of departure in the document from which you came.Copyright (c)Roy Johnston, Peter Millard, 2005, for e-version; content is author's copyright,