Nosokinetics
Modelling Queue in an Emergency Department
(c) Leon K Au
University of Melbourne, Melbourne Health and Australian National University; Government funding to look into ways of improving patient flow at the Royal Melbourne Hospital.
The first part looks at the way patients flow within the emergency department (ED). Approximately 200000 patient data records relating to patient arrivals through the ED between 1 January 2001 and 18 April 2005 were examined. Some preliminary results are detailed in the following two figures:
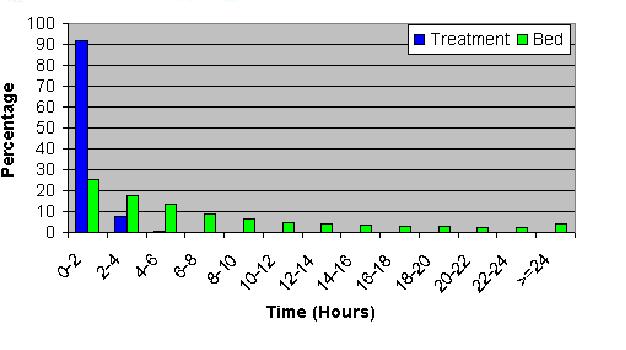
Fig 1: Distribution of the Waiting Time
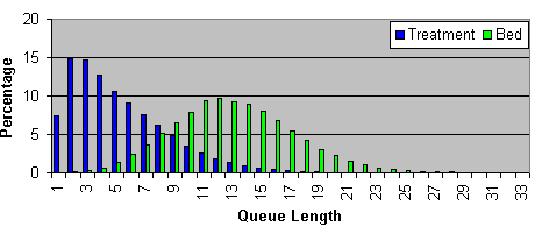
Fig 2: The distribution for the number of patients waiting for treatment and bed admission.
For those seeking additional information, please contact leon@ms.unimelb.edu.au.
Some navigational notes:
A highlighted number may bring up a footnote or a reference. A highlighted word hotlinks to another document (chapter, appendix, table of contents, whatever). In general, if you click on the 'Back' button it will bring to to the point of departure in the document from which you came.Copyright (c)Roy Johnston, Peter Millard, 2005, for e-version; content is author's copyright,