Nosokinetics
Modelling 'Rate of Admission' for Treatment and Bed Queues
Leon K. Au
(University of Melbourne and Melbourne Health)
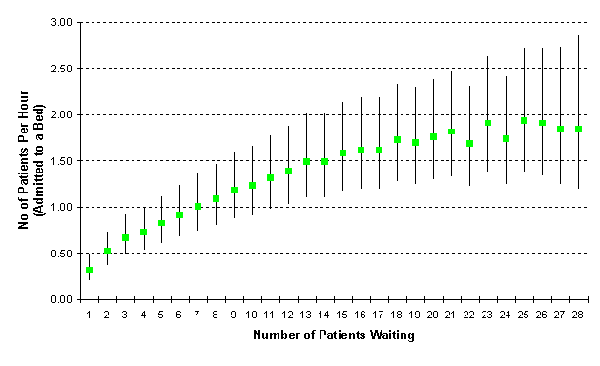
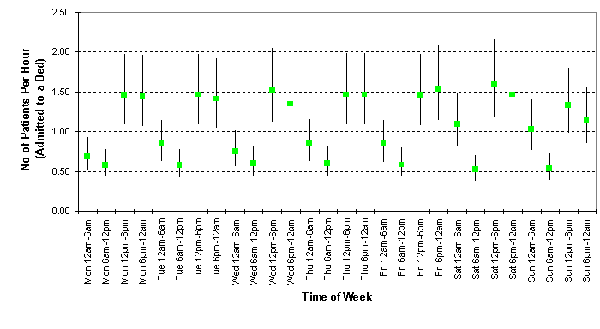
Using the method of survival regression analysis (see 'Analysis of Failure and Survival Data' by Peter J Smith), we estimated effects of both queue length and time of week (Figures 1 & 2).

Figure 1: Rate of admission versus the number of patient waiting for a bed, with 95% confidence intervals.
The rate of admission steadily increases then appears to level off when there are more than 16 patients waiting for a bed. This suggests the capacity of the hospital to respond to increased demand is exhausted by this point.
Figure 2 gives the factor by which the admission rate varies throughout the week: the fitted rate is the product of this with the rate for a given queue length. The figure demonstrates that relatively more admissions occur in early afternoon and late evening of weekdays. The pattern is highly consistent throughout the working week, while there is less variation on weekends.

Figure 2: Rate of admission versus the day of the week for patient waiting for a bed, with 95% confidence intervals.
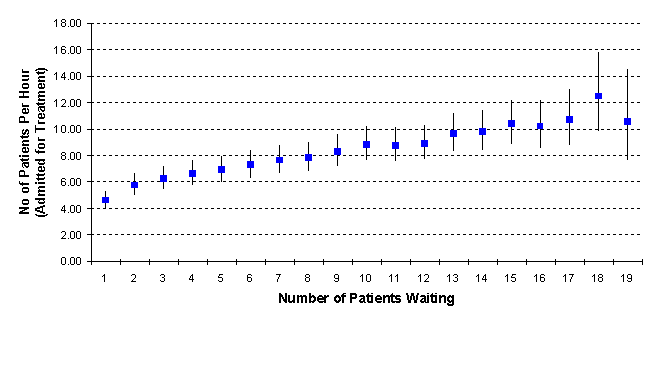
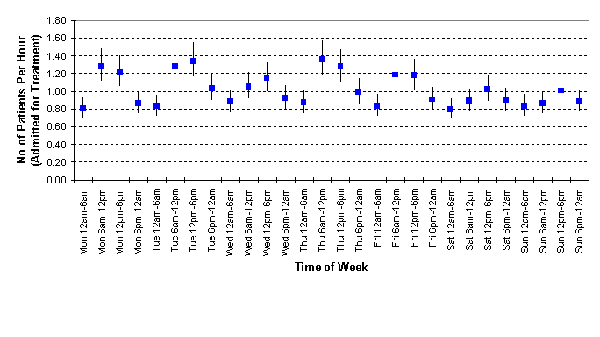
Similar patterns are observed for the number of patients awaiting treatment, as shown in Figures 3 & 4. Note the scale of Figure 3 is larger, as most of those waiting for treatment will be discharged directly from the ED. Also the maximum queue length is shorter, as suggested in our previous article.

Figure 3: Rate of admission versus the number of patient waiting for treatment, with 95% confidence intervals.

Figure 4: Rate of admission versus the day of the week for patient waiting for treatment.
We plan next to investigate differences between treatment queues for patients who will subsequently be admitted, and those discharged from the ED. We will present our next results in a future edition of Nosokinetics News in the near future. Additional information is available by contacting Leon Au at leon@ms.unimelb.edu.au.
Some navigational notes:
A highlighted number may bring up a footnote or a reference. A highlighted word hotlinks to another document (chapter, appendix, table of contents, whatever). In general, if you click on the 'Back' button it will bring to to the point of departure in the document from which you came.Copyright (c)Roy Johnston, Peter Millard, 2005, for e-version; content is author's copyright,