Nosokinetics
Modelling Bed Costs for the Elderly
Barry Shaw and Adele H Marshall
Queen's University, Belfast, Northern Ireland, U.K.
Editorís comment:
By integrating administrative and clinical data Barry and Adele show how computer assisted data analysis reveals the impact of gender, age, dependency and route of admission on duration of stay and outcome. Furthermore, by adding a cost function, they explain why careful attention to the needs of dependent patients could reduce costs and improve outcome.
Using an extension of Bayesian network (BN) theory and Coxian phase type distributions a method of modelling the cost of inpatient care for groups of in patients is developed. Whereby, survival time in hospital is modelled with respect to the interrelationships between the patientsí clinical variables and duration of stay.
Modelling the costs for a group of patients' duration of stay in hospital using an extension of Bayesian network (BN) theory is developed whereby patients' survival time in hospital is modelled with respect to the interrelationships between the patients' clinical variables.
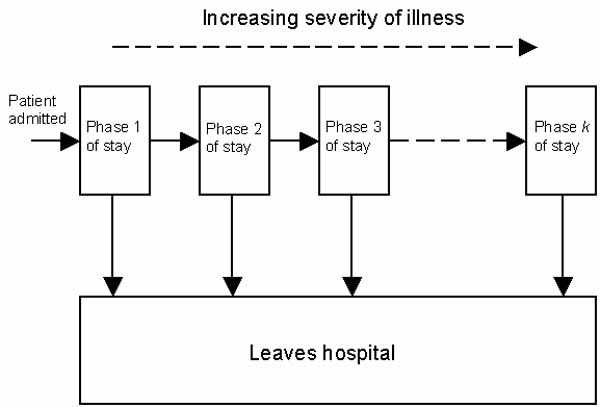
Coxian phase-type distributions, fig 1, model the different phases of patientsí length of stay in discharge data sets. During each phase, patients either leave - by discharge, death or transfer - or continue into the next phase. Thus the process of inpatient care is represented by different temporal stages. The Coxian phase-type distribution may then be conditioned on a Bayesian Network to form a Conditional phase-type (C-Ph) distribution.

Figure 1: Coxian phase-type distribution.
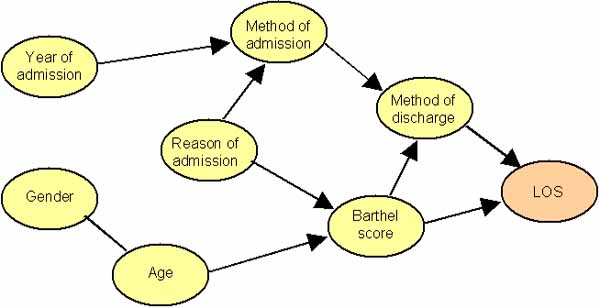
The directional arrows in the Bayesian network, fig. 2, show the factors that influence duration of stay in a hospital department of geriatric medicine. Gender influences age, males die younger. Age and reason for admission influence the Barthel score (a measure of dependency) because older people and patients admitted from other hospital departments tend to be more dependent. Finally, the Barthel score and method of discharge influence the duration of stay.

Figure 2: BN showing how patient information influences LOS.
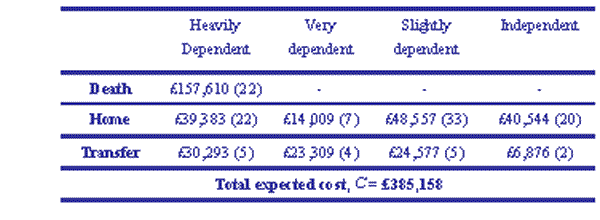
Costs per bed day may then be attached to the different phases of care in the Coxian phase-type distribution (as illustrated in fig. 1). These costs are representative of the stages of care. Table 1 gives the estimated cost for 120 inpatients. The number in brackets represents the number of patients in that cohort.

Extrapolating from the data, the average cost of managing a death is £7,164; discharge, £1737; and transfer, £5315.
The four phases in hospital care may be interpreted as short- term (S1), medium-term (S2 and S3) and long-term (S4) care. Patients who enter the later stages of care (S4) stay for long periods of time as a result they drive up costs, which could be saved if they were enabled to return home. Table 2 displays the cost savings that would occur if the percentage of patients discharged from S2 is increased by 20% and S3 by 95% i.e. if inpatient management could be changed, such that seven fewer patients required long-term-care, the cost of care of the cohort would decrease by 10%.
For those patients discharged home, their LOS can be best modelled by a 4-stage Coxian phase-type distribution. Using the expected LOS in each phase, these may be interpreted as short- term (S1), medium-term (S2 and S3) and long-term (S4) care. It is reported that many patients enter the later stages of care (S4) for unnecessary long periods of time, and as a result drive up costs, when they could return home.
Table 2 considers those dependent patients who were discharged home and displays the results of increasing the percentage of patients discharged from S2 and S3, which may represent medium-stay care. Increasing the percentage of patients from S2 to 20% and S3 to 95% has resulted in 7 fewer patients requiring long-term care and a savings in expenditure of 10%.

In conclusion, the research shows how a Bayesian Network can model the behaviour of patients in a department of geriatric medicine and predict, in a probabilistic sense, the outcome and cost of inpatient care. By altering the parameters in the model, clinicians and managers could identify and discuss possible alternative approaches for cost-effective and life enhancing care.
[1] Marshall, A.H. and McClean, S.I. (2003) Conditional Phase-Type Distributions for Modelling Patient Length of Stay in Hospital, International Transactions in Operational Research, 10, pp. 565-576.
Note: This paper is to be submitted to a Special Issue of IEEE Transactions of Information Technology in Biomedicine.
Some navigational notes:
A highlighted number may bring up a footnote or a reference. A highlighted word hotlinks to another document (chapter, appendix, table of contents, whatever). In general, if you click on the 'Back' button it will bring to to the point of departure in the document from which you came.Copyright (c)Roy Johnston, Peter Millard, 2005, for e-version; content is author's copyright,