Nosokinetics
Simulating Accident and Emergency Services with a generic process model.
Anthony Codrington-Virtue
(RKW Ltd, PhD student, University of Westminster, London)(comments to Anthony.Codrington-Virtue@rkw-uk.com)
Editor's comment. Patients enter and leave hospitals 24 hours a day throughout the year. As well as purpose, structure and function model makers need to consider time, day and method of arrival, degrees of difficulty, age, alternative placement and staff availability. Here research developing a generic process of accident and emergency services is described. Data analysis is important. Look and see how the four hour (political) waiting list targets distorts the pattern of length of stay
Bridging the gap: Challenges and opportunities for modellers
The potential benefit to be gained by simulation modelling of health care systems is huge. Nevertheless, compared to other industries, modelling has a relatively poor adoption in health care. Model builders need to lead the effort to develop models, by improving their understanding of health care needs and challenges (model building) and communication of user-friendly models, to help provide answers and insights into complex health care issues.
Model building
The continued advancement of computing power and visually interactive software opens-up the potential use of user-friendly models. This creates both opportunities and challenges for model builders. Table 1 shows that high abstraction levels are flexible enough to model any system or scenario.

However, high abstraction levels require high levels of knowledge, experience (and often time), to develop models that are sometimes difficult for non-expert users to interrogate. In contrast, low abstraction levels are simple and easy to use, but their use is limited to the system for which they are designed. The challenge is to develop models at medium abstraction levels, which both capture appropriate system complexity and ease of use.
Modelling Accident and Emergency
A framework for the development of a generic processes model using discrete-event simulation and visually interactive software (Simul8) is being created. The framework allows users to input ambulance and walk-in arrivals hourly, over a 24-hour period, over a 7-day week via Excel spreadsheet interfaces. It also allows the user to direct arrivals through a number of different pathways (into minor, major and resuscitation work areas) and to set bed/cubicle/bay resources within the modelled department.During the simulation run, users can see patients arriving in real simulation time, observing monitor their travel through the different work areas as defined by their assigned pathways. The simulation also allows enables users to see resource use and queue activity throughout the run. A snap shot of the simulation model is shown in Figure 1.
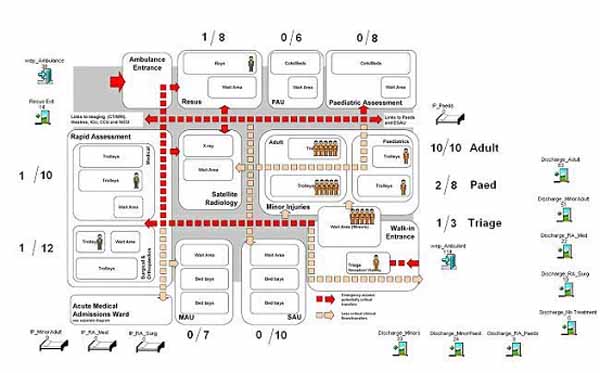
Figure 1. Snap shot of Simulation Mode showing number of patients in different parts of the Accident & Emergency department.
The generic framework also facilitates the testing of new scenarios e.g., resources can be changed and outputs compared by re-running the model. Similarly, process times can be changed and the model re-run to assess impact. Furthermore, the generic framework could be used to assign other attributes to patients for modelling. Initial studies have shown comparable results for mean length of stay between the model and major injury activities in a real A&E department.
The model is being developed in close cooperation with staff in a UK A&E department. Analysis of one year's data shows contrasting patterns of ambulance and walk-in arrivals. The histogram in Figure 2 shows the busy time for walk-in arrivals is between 9.00 am and 9.00 pm, whereas ambulance arrivals continue to come in at approximately the same rate between 10.00 am and 1.00 a.m. The box-and-whisker plot in Figure 3, as one would expect, shows that the duration of stay of ambulance arrivals is greater that for walk-in patients. Notice however that outliers occur in both groups.
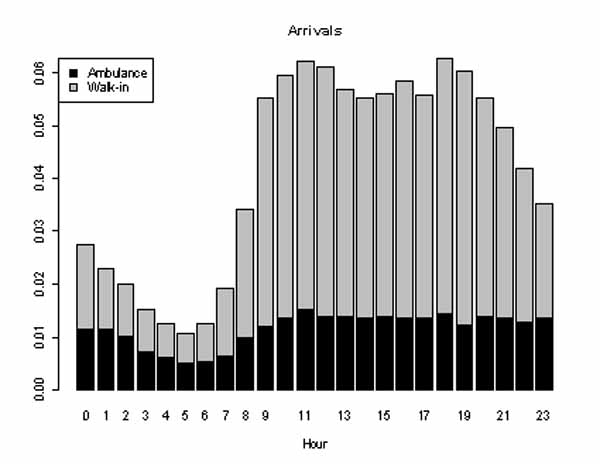
Figure 2. Pattern of arrival of A&E patients on an average day. Black represents shows the ambulance arrivals, grey the walk-ins.
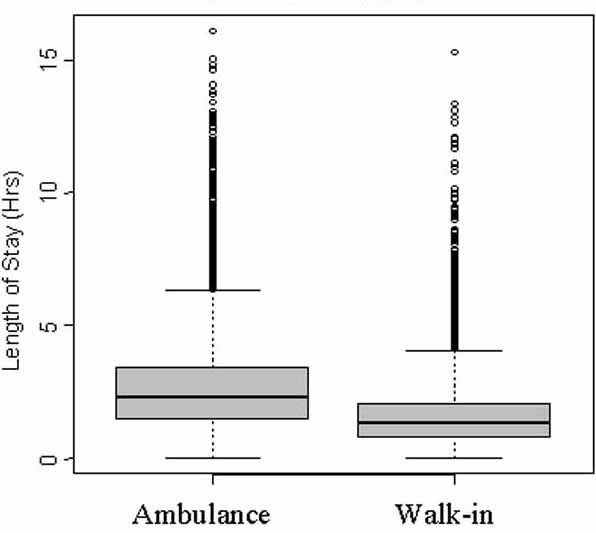
Figure 3. Box and whisker plot showing differences in duration of stay in A & E of ambulance arrivals and walk-in patients.
N.B. In box and whisker plots the box shows the interquartile range, i.e. the distance between the 25th and 75th percentiles and the line in the box is the median stay (50%). The 'hinges' on the whiskers are set at one and a half times the size of the box. Outliers are shown as points outside this range.
For a full explanation see Eric W Weisstein. "Box-and-Whisker Plot", from MathWorld:A Wolfram Web Resource.
Figure 4 and 5 show, respectively, the distribution of duration of stay of ambulance and walk-in arrivals. In both cases, the expected pattern is distorted consequent upon staff struggling to achieve the UK government's 4 hour A & E waiting time target. Also see Locker and Mason (2005)
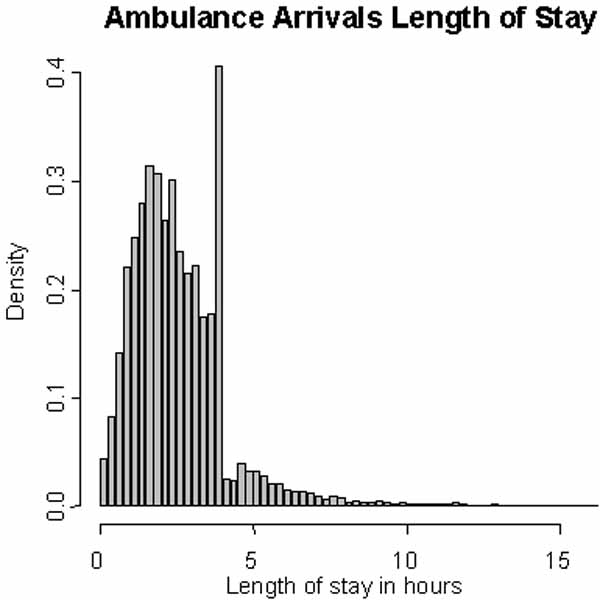
Figure 4. Distribution of duration of stay of ambulance arrivals in the A & E department.
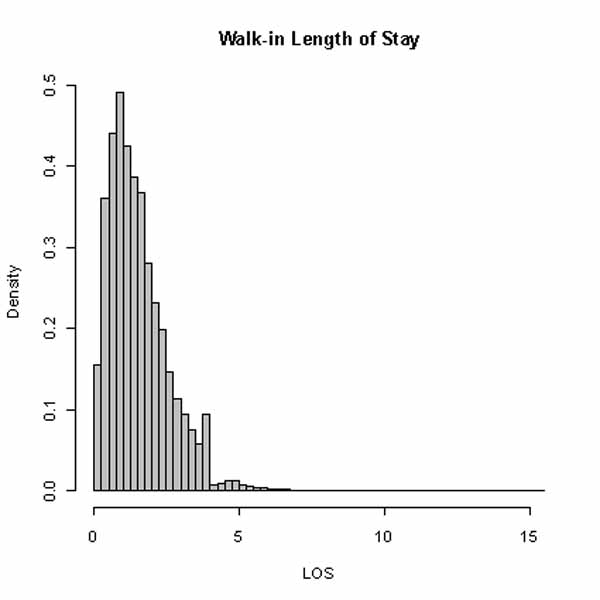
Figure 5. Distribution of duration of stay of walk-in patients in the A & E department.
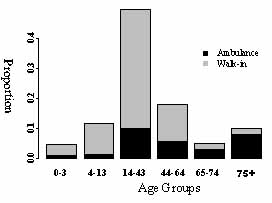
Figure 7 Proportion of ambulance arrivals (black) and walk-in arrivals (grey) by age group.
Locker & Mason's (2005) analysis of duration of stay in 83 UK A & E departments shows that patients who require hospital admission are more likely to stay longer and to be admitted in the final minutes before the 4 hour deadline ends. Taken together with our results, surely different targets should be used for walk-in patients and for ambulance arrivals. From Figures 4 and 5, four hours seems to be appropriate for walk-in patients and six hours for admissions. The model of accident and emergency services is being developed in conjunction with health care strategist RKW Ltd and Thierry Chaussalet's Health and Social Care Modelling Group at the University of Westminster. Combining simulation and service time allows end users to interact visually with the non-homogenous nature of accident and emergency services, and helps provide answers and insights to health care issues. For example, we might further investigate medical, social and or treatment factors that affect A&E length of stay with age.
(The model of accident and emergency services is being developed in conjunction with health care strategist RKW Ltd and Thierry Chaussalet's Health and Social Care Modelling Group at the University of Westminster. Combining simulation and service time allows end users to interact visually with the non-homogenous nature of accident and emergency services, and helps provide answers and insights to health care issues. For example, we might further investigate medical, social and or treatment factors that affect A&E length of stay with age.)
Reference: T.E. Locker and S.M. Mason, Analysis of the distribution of time that patients spend in emergency departments, British Medical Journal 330 (2005) 1188-1189.
Some navigational notes:
A highlighted number may bring up a footnote or a reference. A highlighted word hotlinks to another document (chapter, appendix, table of contents, whatever). In general, if you click on the 'Back' button it will bring to to the point of departure in the document from which you came.Copyright (c)Roy Johnston, Ray Millard, 2005, for e-version; content is author's copyright,