Nosokinetics
Could a DSS do this?
Analysis of coping with overcrowding in a hospital emergency department
Red Ceglowski, Department of Accounting and Finance, Faculty of Business and Economics, Monash University.
(comments to rjtechne@iol.ie)
Unless you’ve been very healthy for the past 10 years, avoided conversations that involve experiences with the healthcare system, and lived as a recluse away from all forms of media, you’ll be aware that there are occasionally problems with getting fast access to care in most hospital emergency departments (EDs). If you’re like me, you take a deep breath when forced to visit an ED and hope that the wait won’t be too long. If you’re particularly perverse you’ll hope that your injury in severe enough for you to be triaged as quite urgent because you know that you’re less likely to wait for treatment than if you’re low in the urgency ratings.
Ordinarily, however, our fears are unfounded. We are courteously received, efficiently triaged and professionally treated - all within reasonable time. Yet if we look at the numbers of patients passing through a typical ED we see that they run at capacity almost all the time. So how do they do it? How do the nurse managers repeatedly solve a hugely complex dynamic non-linear optimisation problem and keep things running relatively smoothly, despite the unpredictability of patient numbers and variety of ailments?
We’d love to be able to give the answers to this question. Those of you who have contact with EDs know that nurse managers are a special breed. That’s about all we have been able to glean from my investigations into how they do it. This article will instead look at just how well they do what they do (put up to 60 patients “into” a ‘40’ bed facility) and suggest how they do it.
Before we start we would like to thank Mark Isken(1) for use of his excellent OpenHillmaker software. This must solely be accredited with any insights. Our work was simply to access the patient data, clean it up and put it into the correct format. Then we ran the OpenHillmaker analysis and sat back to enjoy the show.
ED Operations and facilities
Operations in this ED are typical. Patients arrive at indeterminate times. A qualified medical (triage) practitioner determines how long the patient may wait for medical attention. Patient severity is evaluated and classified into urgency levels. This ‘triage’ procedure is standard in lmost all EDs worldwide and in Australia triage classifications range from 1 (most urgent) for “immediate attention required” to 5 (least urgent) for “attention within two hours” (Australasian School of Medicine 1994). Patients are shown to the first available treatment site (most commonly a bed in the emergency department, but it may be a ‘treatment chair’ in the case of less serious presentations) and treatment initiated through the attention of qualified medical staff. During treatment phase, a decision is also made whether to admit the patient to hospital or whether to discharge them home. Specific “disposal” codes are also used for patients who leave before treatment is complete and for patients who die in the ED.The emergency department described in this work is typical in setting and complexity. It is allied to a 300 bed metropolitan hospital that provides health care to nearly 290,000 people in the local region, with a seasonal influx of up to 100,000 visitors. The area is a prime retirement location, so there is a high proportion of older people. The local population growth rate is predicted to be 18.9% and the number of people over 70 is expected to double in the next ten years.
At the time the data was gathered the emergency department utilised 33 beds as follows: 8 for acute patients; 5 for paediatric patients; 6 for observation; 5 for general care; 3 for resuscitations; 3 consultation rooms; 3 for triage rooms and 1 isolation room for infectious diseases. Although the beds were allocated based on certain rules, they could also be used interchangeably, with the exception of the resuscitation area which was (and is) reserved for urgent patients. The hospital provides imaging and laboratory services.
The department currently has senior medical staff comprised of 6 full time Emergency Physicians, 1 part time Emergency Physician, 1 part time Paediatrician, 1 full time and 1 part time General Practitioner and 2 part time Clinical Fellows in Emergency Medicine. The triage area has 2 triage nurses and there are a number of nurses who support the various areas described above. In addition there are clerical staff who perform administrative tasks related to patient management and a number of patient services assistants who are responsible for transporting patients and other services. A nurse manager oversees patient traffic flow, in addition to the support provided by the emergency department information system - a computer workflow system that indicates details of patients in and awaiting treatment but does not provide further decision support.
The Data
The data consisted of 56906 de-identified records of all ED presentations in 2002. The records contained demographic information plus details of the visit such as “presentation problem”, urgency, key time points and “disposition”. Data on medical procedures undergone by patients were combined with the records of ED presentations so that each record contained demographic and visit information, as well as all medical procedures performed during that visit.
ED Occupancy
For us one of the best features of OpenHillmaker is the graphical output. Figure 1 gives the graph for ED occupancy in 2 hour slices by day of week. One of the first things we noticed was the typical ‘camel hump’ of occupancy by day as arrivals gradually increase through the morning and peak in early evening. The next think was the high average occupancy. The ED staff care for at least 20 patients most of the time and rarely less than 10. On average the peak ED occupancy is around 33 beds which makes the administrators happy because it indicates that the ED is big enough and they don’t need to spend money increasing the number of beds, no matter how much the staff claim that the ED is overcrowded.
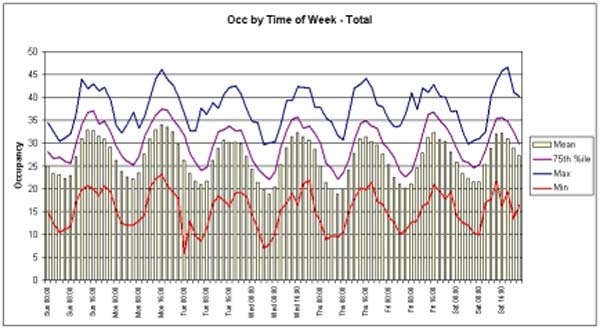
Figure 1: Occupancy in the ED (between being shown to a bed and physically departing the ED)>
But wait! What about peak occupancy? How can it be that the ED ever has more than 33 patients simultaneously booked in, never mind the figures of 50 that the data shows us? The 75th percentile shows us that such overcrowding is not that infrequent, too. Administrators: possibly the ED staff have a point?
It’s possible to break occupancy down by urgency, disposal or other categorical field in the data. One can immediately see the impact that hospital admissions can have on the ED by looking at the subgroup of patients who are awaiting admittance to a hospital ward (Figure 2).
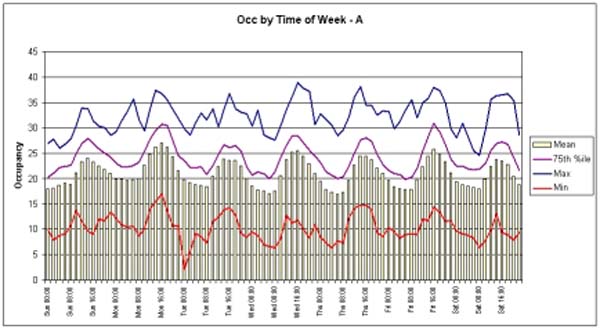
Figure 2: Patients awaiting admittance to a hospital ward >
It’s immediately obvious that the bulk of patients in the ED at any given time are awaiting hospital admittance. Since the decision to admit is usually made very early during ED treatment, and while some patients do need to be stabilised in the ED before they can be moved, in the vast majority of cases the ED is ‘forced’ into treating these patients because of delays in getting them admitted to hospital. It’s staggering to think that more patients may be in the ED awaiting hospital admittance than there are beds in the ED. Whence the press cameras and splashes of patients on trolleys in corridors along with sensationalist stories of pain, suffering and neglect in hospital corridors.
A note: This ED, like most these days, has instituted a “Short Stay Unit” specifically for patients awaiting admittance. Such units are a mechanism whereby EDs can temporarily admit patients and so meet regulations (often funding related) regarding timeous admissions. The graphs above show the situation for patients in the ED before transfer to the Short Stay Unit. This transfer occurred at 4 hours and can be seen in the data as a truncation of patient length of stay in the ED at the 4 hour mark.
Nurse managers and the supply chain
Investigations such as those given above are fascinating and enlightening. They force us to revisit our understanding of the neat, clear process pictures we have and challenge our mental models. So what’s happening? How do the nurse managers pack them in so?Anyone who has played the famous “Beer Game” management simulation will immediately have an answer. The Beer Game is a model of a supply chain from beer manufacturer (The choice of product is probably a vagary of the originators) to customer. It encompasses a retailer, distributor and wholesaler. Each of these have to forecast future demand and make decisions about how much beer to order. Of course there are delays in transmitting the orders from the retailer to manufacturer, and the manufacturer has limited capacity (it takes time to brew good beer, you know!). Most importantly, it takes time to ship the beer from each unit in the supply chain to the next.
A sawtooth of stock variation is a typical outcome from a Beer Game as the retailer tries to anticipate demand and order accordingly but fails to adequately compensate for delays in the supply chain. Beer lakes and droughts often occur at every point in the chain. A final accounting of all the beer always shows that some is missing. It is not in the retail store nor any of the other units (but some may be in the players!). Where is it? It’s on the trucks, of course, being delivered from one to the next.
No doubt you’ve made the connection by now. Some of the extra ED patients are nestled in treatment chairs, squirreled away in consultation rooms, or being treated in triage beds, but most of the missing patients are probably travelling to, or waiting outside, imaging centres or other specialised treatment rooms. How do the nurse managers hold it all in their heads? We don’t know, but sure are impressed.
Reference
1. Mark Isken, Associate Professor, Dept. of Decision and Information Sciences, School of Business Administration, Oakland University;isken@oakland.edu, http://www.sba.oakland.edu/faculty/isken/
Some navigational notes:
A highlighted number may bring up a footnote or a reference. A highlighted word hotlinks to another document (chapter, appendix, table of contents, whatever). In general, if you click on the 'Back' button it will bring to to the point of departure in the document from which you came.Copyright (c)Roy Johnston, Ray Millard, 2005, for e-version; content is author's copyright,