Nosokinetics
A Word on Queueing Networks
J. Preater
Mathematics Department, Keele University (comments to rjtechne@iol.ie)
Extracts from an email conversation between Roy Johnston and myself on queueing networks, or ’queues within queues’, have appeared in recent editions of Nosokinetics News. This article comprises a brief account of these networks.
Imagine a post-office-like counter system: customers enter at random, wait in line for a free server, receive service and leave. Speaking roughly, the first half-century of the scientific study of queues was concerned with understanding such systems; the second half-century - bringing us up to the present day - has, additionally, glued these individual queues together to form a network in which customers departing from one queue may join another. This upward step of complexity is motivated by mathematical inquisitiveness together with applications in computer science and manufacturing systems, but it could equally have been prompted by patient flow through health care systems.
One may identify four kinds of queue, illustrated in Figure 1 [these diagrams are taken from a bibliography of queues in health and medicine covering years to 2000 which is available from myself j.preater@keele.ac.uk].
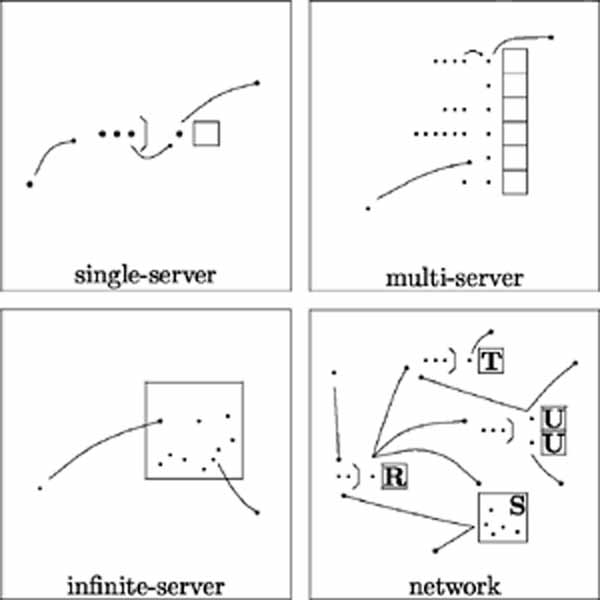
Figure 1: Types of queueing system.
The simplest, single-server queue is a special case of the multi-server system already mooted. The infinite-server queue, where the length-of-stay of a customer is not dependent on the number of fellow customers, used quaintly to be proposed as a model for emergency bed provision. These are the building blocks of networks.
That depicted in the Figure comprises four nodes: R and T are single-server, U is 2-server and S is infinite-server. Customers - let us now say patients - enter the system by joining the queue at node R. When their service there is complete they join one of the queues at S, T or U, and from thence either leave the system or move to another node. Patients can therefore visit nodes more than once. The interpretation and arrangement of nodes is the prerogative of the modeller: for instance, R might represent a triage point, S a rest area, T a scanner and U a suite of treatment rooms.
For any system, the primary purpose of the network model is to understand how performance - measured by waiting times at nodes, lengths-of-stay in the system, congestion patterns, resource utilization, etc. - is affected by the architecture of the system and by the values of its parameters, such as external arrival rates, service rates and priority rules at nodes. Models may either be specific to an actual system or generic, promoting understanding. As usual, there is a tension between simplicity, graspability and clarity of analysis on the one hand and realism, relevance and plausibility on the other. There is often mileage in building more than one model for the same system.
The remainder of this article concerns a simple toy network model of Lilliput Hospital. The structure is shown in Fig 2 below:
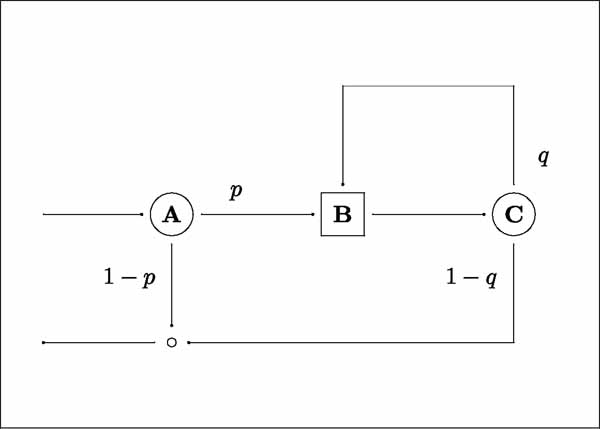
Figure 2: Lilliput Hospital.
Patients arrive at rate lamda at the infinite-server node A, representing acclimatization, administration and assessment. The hospital has n beds, and Lilliputians admitted when all beds are occupied are accommodated on small trolleys. Following an initial clinical decision a proportion p of patients require treatment at node B, which is modelled as a single-server, first-come-first-served queue; the other 1 — p are pronounced well and discharged.
Subsequent to treatment at B a patient moves to the infinite-server node C for recuperation and to await another clinical decision: this entails, with probability q, further treatment at B, or, with probability 1 — q, discharge. Thus a patient may undergo several rounds of treatment. Mean lengths-of-stay at A and C are a and c, respectively, while the actual procedure at B has mean duration b.
At this point, poised to investigate how performance relates to the parameters a, b, c, p, q and n, the analyst asks, with bated breath, what are the statistical distributions of the lengths-of-stay at nodes A and C and the procedure durations at B. The answer comes back Exponential(-ish). Overjoyed the analyst proceeds to generate some results.
And here is a sample. First, for the system to be stable, i.e. for the mean occupancy to be finite, it is necessary that
arrival rate = lamda < lamda* = (1 - q)/bp = maximum arrival rate.
Because of this it is convenient to choose as the final system parameter not ë itself, but rather
proportion of capacity used = x = lamda/lamda*.
Various performance measures of interest to the hospital or the patient may then be calculated; for example:
throughput = lamda = xlamda*,
mean occupancy = L = d + x/(1 - x),
mean length-of-stay in hospital = W = L/lamda,
probability of admission to a trolley:
p(trolley) = 1 - sigma(m=0 to n-1) exp(-d) d(m)/m! [1- xpower(n-m)],
where d = lamda[a + cp/(1 - q)]. The third formula is the apposite Little’s law, which applies to most stable queueing systems.
To get a print-friendly maths version of the above, go to preater4.pdf.
For numerical illustration let us suppose that n = 20 beds, a = 1 day, b = 0.2 days, c = 2 days, p = 0.8 and q = 0.3. The above formulae then yield the results in Table 1 for different values of x; these evince the usual stark consequences of squeezing too close to capacity.
 x     lamda     L       W     ptrolley
0.2	0.88	3.1	3.6	0.000
0.4	1.75	6.4	3.7	0.000
0.6	2.63	10.1	3.9	0.011
0.8	3.50	15.5	4.4	0.200
0.85	3.72	17.9	4.8	0.329
0.9	3.94	21.9	5.6	0.505
0.95	4.16	32.7	7.9	0.731
0.99	4.33	113.2	26.1	0.943
Suffice it to say that the nice product-form would remain even if, for example, Lilliput hospital replaced B with a complex of treatment nodes among which patients moved along (up to a point) history-dependent pathways, if the service rate at a node depended on the number of patients there and if patients who could not be provided with a bed were diverted elsewhere. But; slip in one node at which the service time has, say, a uniform distribution, or introduce dependence of one part of the system on another, or ... and the product-form is lost. This does not mean that analytical progress is impossible - it depends on the precise assumptions and what the analyst wishes to know - but things go less swimmingly.
If analytical approaches are not feasible then a simulation model is required. And this is fine. Extra system complexities can be appended with ease, performance statistics collected and a helpful user interface designed, perhaps incorporating an animation of patient flow through the system (such models are common in manufacturing). The price one pays is that conclusions are less crisp and a lot of interaction with the model may be required to acquire a reasonable understanding of system behaviour.
The best place to start to learn about queueing networks is probably selected chapters of general Operational Research texts e.g., [1]. There are more technical treatments in [2], in the classic [3] and in [4]. Beyond this there are scores of other monographs and thousands of research articles in Operational Research and Applied Probability journals and elsewhere; these often concentrate on mathematical properties, but nevertheless have an eye to applications.
References
Hillier, F. S. & Lieberman, G. J. Introduction to Operations Research. Pearson.Kleinrock, L. Queueing Systems. Wiley.
Kelly, F. Reversibility and Stochastic Networks. Wiley.
Chen, D & Yao, D. Fundamentals of Queueuing Networks: Performance, Asymptotics and Optimization. Springer-Verlag.
Some navigational notes:
A highlighted number may bring up a footnote or a reference. A highlighted word hotlinks to another document (chapter, appendix, table of contents, whatever). In general, if you click on the 'Back' button it will bring to to the point of departure in the document from which you came.Copyright (c)Roy Johnston, Ray Millard, 2005, for e-version; content is author's copyright,