Nosokinetics
On-Line Analytical Processing (OLAP)
in the provision of health care:
building capacity for exploratory data analysis and facilitating decision making
Christos Vasilakis PhD
Senior Lecturer, Harrow School of Computer Science, University of Westminster, C.M.Vasilakis@westminster.ac.uk
(comments to rjtechne@iol.ie)On-Line Analytical Processing (OLAP) is the software technology that enables analysts and managers to gain fast access to large amounts of summarized data stored in data warehouse. Both storage and presentation of the data reflect the dimensionality of the organisation as understood by the user.
OLAP can provide health managers and care givers with the capacity to perform fast interactive data exploration and analysis on large amounts of administrative and clinical data through an intuitive graphical user interface.
Health data however, have unique characteristics that distinguish them from common business examples, an aspect that makes the direct adaptation of the already established business oriented solutions difficult. Practical solutions and a working prototype software tool have been described and developed to aid in the analysis of bed occupancy and hospital length of stay (LOS).(1,2)
The working prototype allows users to quickly generate graphs and tables with for example, daily admissions, discharges and bed occupancy over a period of time; moving averages of the above metrics over a period of time; and frequency distributions of hospital LOS. Here we illustrate the potential benefits to be gained by introducing OLAP data analysis using stroke data from the English National Hospital Episode Statistics (HES) database. The data concerns patients aged 65 and over discharged between April 1st and March 31st 1995: (148,251 Finished Consultant Episodes and 105,765 completed inpatient spells).
Figure 1 shows that the distribution of the LOS ranges between weeks and years. The mean duration of stay is 14.3 days, the median 7 days and the standard deviation 52 days, giving a coefficient of variation of 363%. The positive difference between the mean and the median suggests that the data is skewed with a long tail of distribution to the right.
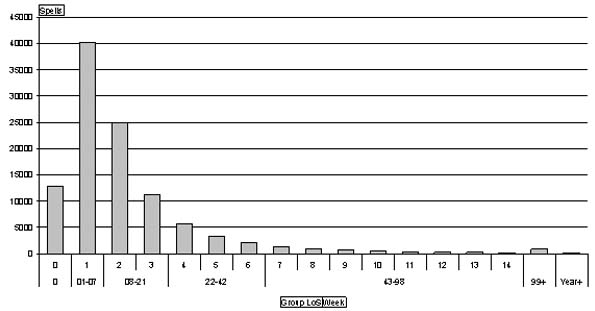
Figure 1. LOS distribution in the stroke data set. The groups refer to patients who are in 0 days, less than a week, 1-3 weeks, 4-6 weeks, 7-13 weeks and 14+ weeks.
Most stroke patients are short stay. The 25th percentile is 3 days and the 75th 15 days, however, as the strata plot below shows, the majority of the beds (almost 90%) are constantly occupied by patients who stay for more than one week, Figure 2.
The strata plot shows the pattern of daily bed occupancy between April 1994 and Feb 1995. Notice the saw tooth nature of weekly bed occupancy and the Ĺshockĺ of Christmas. See how the short stay bed numbers decrease as patients staying for three weeks or less are discharged, and the longer stay patients increase as social services take their annual break. Notice too, the artefact off decreasing long stay patients, because the downloaded data did not include a bed census on the last day.
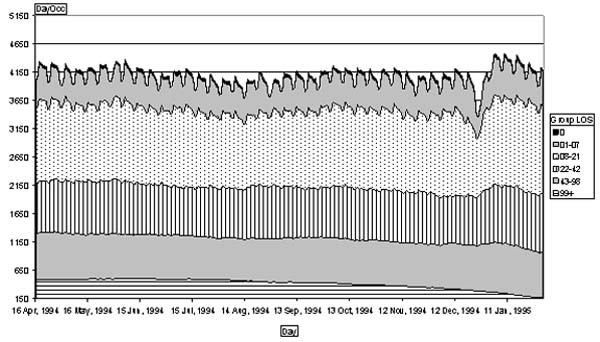
Figure 2. Strata of daily bed usage by stroke patients aged 65+
Using an OLAP software tool hospital managers and care givers can easily bring into or remove from the graphs and tables the dimensions and metrics contained in the data. For example, Figure 3 shows how destination at discharge influences the average LOS of patients aged 65 and over discharged from English acute hospitals per discharge destination.
A benefit of OLAP is that it enables explanatory investigation of differences in outcome in large data sets.
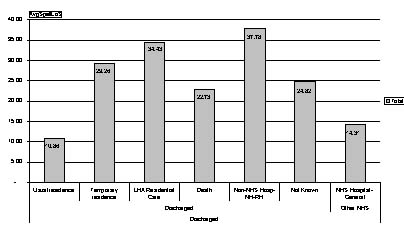
Figure 3. Average LOS per discharge destination of stroke patients aged 65 and over in English Hospitals.
Dimensions may include patient demographic information (e.g. patient sex, age), clinical information (e.g. diagnosis, treatment) or administrative information (e.g. source of admission, discharge destination). Metrics include number of patients in the hospital, number of admissions and discharges (total or daily numbers), hospital bed days, hospital LOS (average and variance), daily occupancy (crude and moving average). A further feature, illustrated here (Figure 4) is that the time component of the process of care can be compared.
In Figure 4 the number of discharges, the mean (?) and standard deviation (?) of the LOS of stroke patients aged 65 and over in the fourteen regional health authorities in England is displayed. Clearly, there are marked differences in the numbers treated and in the statistical values of the LOS distribution. Further analysis is needed to explore our hypothesis that the most likely reason is differences in the local availability of resources for transfer elsewhere.
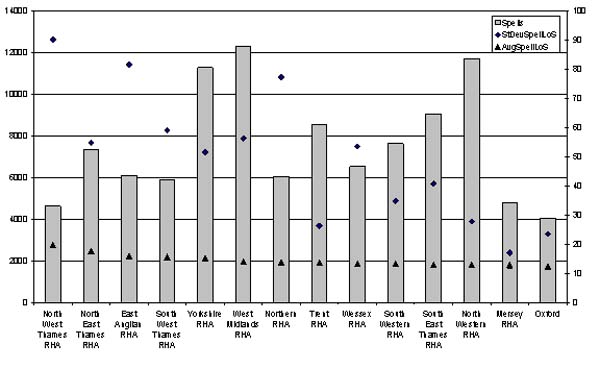
Figure 4. Number of spells, average and standard deviation of LOS of stroke patients aged 65 and over in English Regions.
The research described here was part of a doctoral thesis. The prototype has been tested on both hospital administrative databases and national health databases (Hospital Episode Statistics). It has been developed using widely available software including MS Access, MS Excel, and SQL Server 2000 Analysis Services, while the full OLAP functionality can also be accessed by using a web browser.
References
1. Vasilakis C. Simulating the flow of patients: an OLAP-enabled decision support framework [Ph.D.]. University of Westminster, 2003.2. Vasilakis C, El-Darzi E, Chountas P. An OLAP-enabled environment for modelling patient flow. Proceedings of the 3rd IEEE Conference on Intelligent Systems (IS'06), 2006:261-266.
Some navigational notes:
A highlighted number may bring up a footnote or a reference. A highlighted word hotlinks to another document (chapter, appendix, table of contents, whatever). In general, if you click on the 'Back' button it will bring to to the point of departure in the document from which you came.Copyright (c)Roy Johnston, Ray Millard, 2005, for e-version; content is author's copyright,