Nosokinetics
A Method for Determining an Emergency Readmission Time Window
Eren Demir, PhD student, HSCMG University of Westminster
(comments to rjtechne@iol.ie)The National Health Service defines re-admission (based on expert opinion) as an emergency admission to the same hospital within 28 days following discharge (Healthcare Commission, 2005). Due to lack of consensus in defining readmission time interval, we develop a modelling approach in determining an appropriate time window, within which an admission is classified as a readmission.
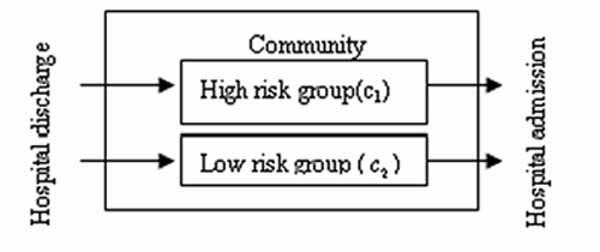
Figure 1 Two groups of patients in the community following discharge from hospital.
The optimal cut-off in time to admission that separates the high and low risk group is determined by solving, that is, where the two corresponding curves intersect.
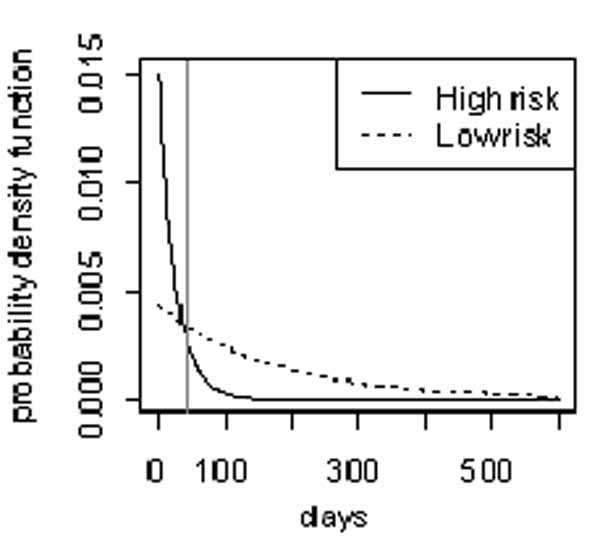
Figure 2 Curves represent high and low risk probability density function. Vertical line represents point of intersection
Results
Using the hospital episodes statistics dataset from 1997 to 2004, we focused our study on chronic obstructive pulmonary disease (COPD), one of the leading causes of readmission. The mean time spent in the high risk and low risk group is 25 and 171 days respectively. The estimated probability of a patient being in group is 0.26 and the cut-off in time to admission, where the two curves intersect at days (Figure 2). We further estimated time window for 5 strategic health authorities in London, which clearly shows that there is a marked difference among the regions.
Strategic Health  Optimal time    Probability of belonging
Authority         window (days)   to high risk group

North East          31.8                0.302
North Central       28.2                0.278
North West          28.8                0.288
South East          26.9                0.271
South West          18.7                0.212
Some navigational notes:
A highlighted number may bring up a footnote or a reference. A highlighted word hotlinks to another document (chapter, appendix, table of contents, whatever). In general, if you click on the 'Back' button it will bring to to the point of departure in the document from which you came.Copyright (c)Roy Johnston, Ray Millard, 2005, for e-version; content is author's copyright,