Nosokinetics
title?
author?
(comments to rjtechne@iol.ie)Abstract: Improving the efficiency of A&E departments is a priority for the NHS and new targets are being introduced to assist this. In Northern Ireland the new target states that by April 2008, 95% of all patients should spend no longer than 4 hours in total in the department. Analysis of a local hospital dataset, recording all new A&E attendances over a one year period, indicates that currently, only 80% of patients are meeting this target.
Identifying heterogeneity
From the dataset it was possible to identify patient pathways and two streams of patient passing through the department - patients who require a decision to admit to hospital (DTA patients) and patients who don't have a decision to admit (no DTA patients). The results indicated that the DTA patients spend significantly longer in A&E than no DTA patients (p-value <0.001). Therefore, when considering total time in A&E, the two streams should be accounted for and modelled separately.
Patient pathway through A&E
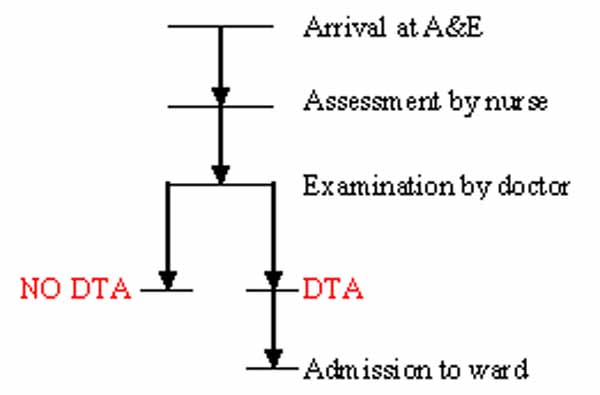
Figure 1 Two groups of patients in the community following discharge from hospital.
Results
It was found that a lognormal distribution with probability density function (pdf)
Current work involves studying classification methods as a possible way for predicting patient streams, and the development of more accurate models of waiting times.
Insert
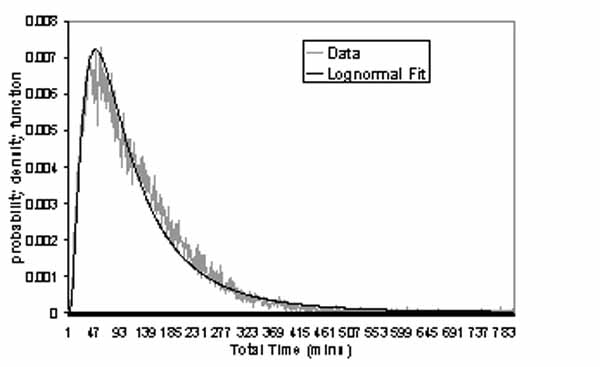
Figure 2 Results of fitting a log-normal model to the total time in A&E for patients with no decision to admit.
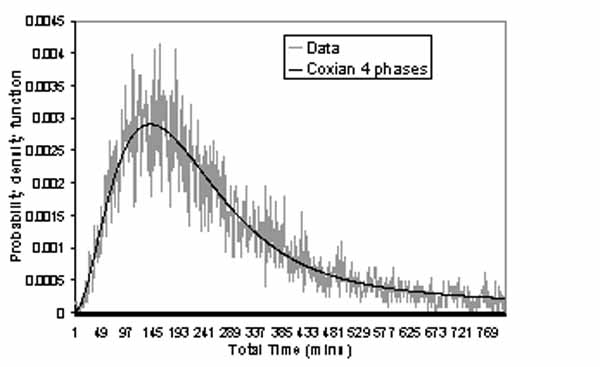
Figure 3. Results of fitting a 4-stage Coxian phase-type model to the total time in A&E for patients with a decision to admit.
Some navigational notes:
A highlighted number may bring up a footnote or a reference. A highlighted word hotlinks to another document (chapter, appendix, table of contents, whatever). In general, if you click on the 'Back' button it will bring to to the point of departure in the document from which you came.Copyright (c)Roy Johnston, Ray Millard, 2005, for e-version; content is author's copyright,